Power BI integration with Microsoft Lists
Visualize and analyze your data on the dashboard of your dreams
Hello Peer,
“It all depends on what you visualize.” — Ansel Adams
“To learn from Microsoft Lists, you must analyze.” — Mark Kashman
OK, I’m quoting myself. There, I said it. No, really, I said it, thus I quoted myself. We’re getting stuck in a recursive loop (he said with air quotes). Let us move on.
The real value lies in how you can both visualize and analyze your data - bringing Ansel and Mark together (a dream of mine from the moment I saw Yosemite Valley through his lens).
Beyond my photographic fantasy, the intent of this article is to spotlight new integration work between Microsoft Lists and Power BI. The combination will help move beyond visualization (no offense Ansel) to analyze and derive insights from your information, leading to action and change. I, too, sprinkle in a few FYIs about the broader integration work between Lists and Power Platform, plus a segment on how you can create a list from Excel and analyze back in Excel to the benefits of enhanced spreadsheet collaboration.
Visualize your list with Power BI
The Microsoft Lists and Power Platform engineering teams continuously work together to give you options to design, customize, and extend your lists. Power Apps enables custom list forms, often to bring in additional external data sources. And with Power Automate, you can design and run more complex workflows. All the while, your list remains the primary data source on the backend.
What would you say to creating powerful dashboards, from your list, in almost one click?
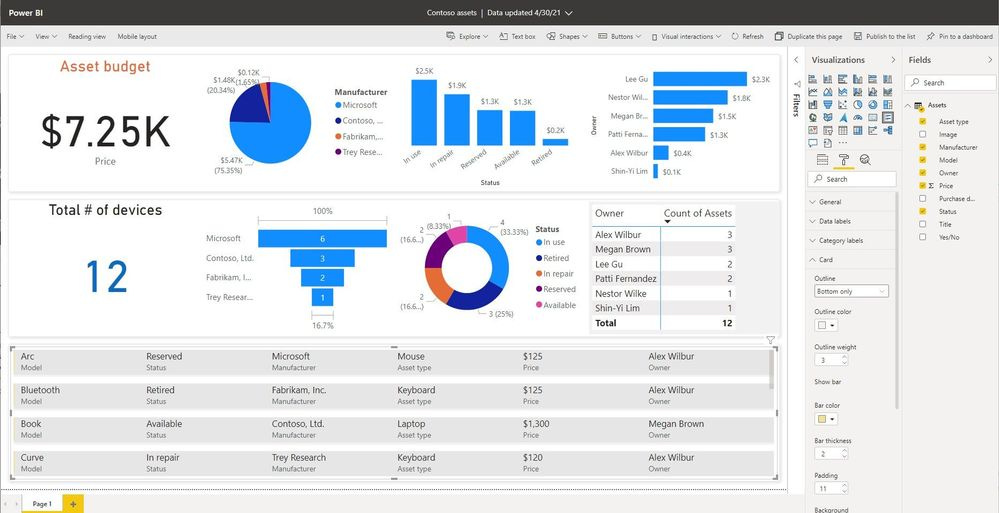
We are excited to announce the arrival of a new guided experience in Lists that will make it easy to create business intelligence reports in Power BI, again using your list data as source.
It’s best to see it in action. Get an 8 minute 30 second first look at Microsoft Lists integration with Power BI:
List users will see a new option in the Integrate menu: Power BI. Then, click Visualize this list to create a new Power BI report. With just one click, you'll be able to autogenerate a basic report and customize the list columns that are shown in the report. To take further advantage of Power BI, go into Edit mode. Once the report is to your liking, saved and published, it will appear in the same submenu under Integrate> Power BI > [your report].

A few notes on licensing: Users with a Microsoft 365 E5 license or Power BI Pro license will have access to the full report authoring and viewing experience. Users without either of those licenses will be prompted by Power BI to sign up for a 60-day free trial. Users with a Power BI free license may only visualize their list data but cannot publish nor view reports.
Learn more how to view and manage Power BI user licenses and get started creating in the Power BI service.
Create a list from Microsoft Excel and let the collaboration begin
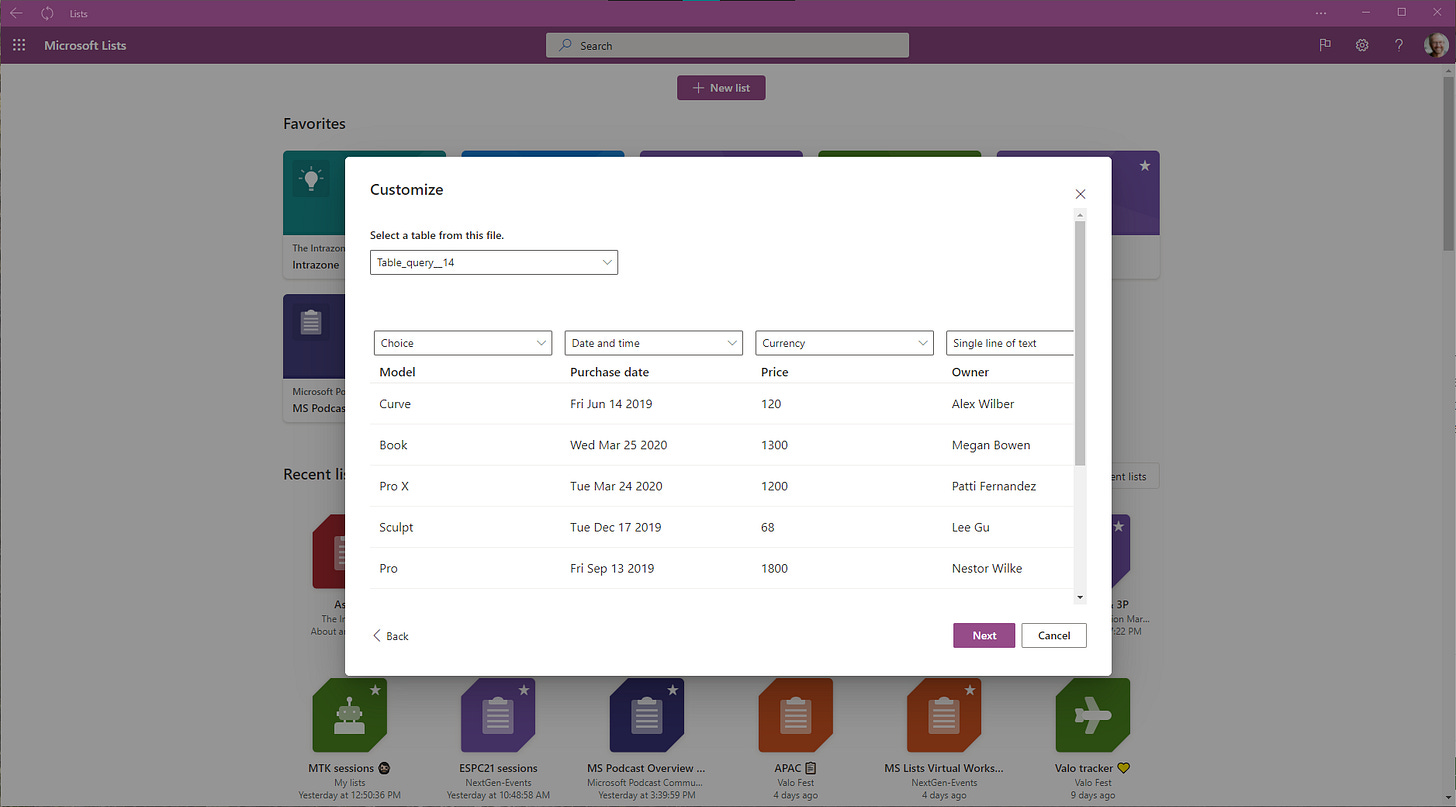
To create a list from Excel, you can select a table from the Excel files in the SharePoint site, or from your device. You can change the field type of the column if needed, and all your table data will be copied to the new list. Your data is now intact in your new list and ready to collaborate at scale, configure with additional columns and views, apply conditional formatting, rules, reminders and more.
You can then analyze your information back in Excel at any time. Simply click Export to Excel. Note: Excel creates an Excel table with a one-way data connection based on a web query file. To bring a fresh copy of the list to Excel, select Refresh All on the Data tab from within Excel. Save the Excel file and you save the connection to the list. Open it any time, refresh and go - do that spreadsheet thing you do and know so well.
Note: Changes made to the Excel table will not be sent to the SharePoint list.

Learn more about how to create a list from Microsoft Excel and how to export to Excel from SharePoint.
Final thoughts
Get ready to build the dashboard of your dreams. If you can visualize it, you can analyze it and learn. With the right insights and informed decisions, the agility of business smartly ducks and dodges - more often right than wrong. You’ll answer the common question, “how are we doing?” with, “Well, let me show you.” And that is the answer that keeps on giving.
Cheerios, Mark “Visualize and analyze this!” Kashman
P.S. (Pun Sharing)
Get your eye rolls ready to bake… one pun from me, @mkashman 🙄, and one from the world:


Hi, is there a way to get connected to the Microsoft List without the need to export to excel first? I had earlier setup Microsoft List like a Kanban Board which I would like to analyze the data accordingly in power BI
It's a great feature to visualize a list with Power BI by creating a new Power BI report.